
Managing inventory is not just about keeping shelves stocked. It is about striking the right balance between supply and cost. Order too much, and you are stuck with excess stock eating up warehouse space. Order too little, and you risk stockouts that disappoint customers and delay fulfilment. For many retailers and supply chain teams, this balancing act becomes a major cost driver.
That is where Economic Order Quantity comes in. EOQ is a simple but powerful formula that helps businesses find the ideal order quantity, the one that minimises total inventory costs across both holding and ordering. Used well, economic order quantity in inventory management reduces holding costs, sharpens order planning, and optimises stock levels without guesswork. Here is how EOQ works, why it matters, and how applying it can unlock real savings.
What Is Economic Order Quantity (EOQ)?
Economic Order Quantity (EOQ) is the ideal order size that minimises the total cost of ordering and holding inventory. It answers one question: how much stock should you order at a time to meet demand while keeping costs as low as possible? It is most useful for businesses that reorder the same products regularly and want to optimise how much they buy and when.
The value sits in the trade-off it solves. Order too frequently and ordering costs climb. Order in large batches and holding costs climb. EOQ finds the data-backed sweet spot between the two.
The EOQ Formula
The standard EOQ formula is:
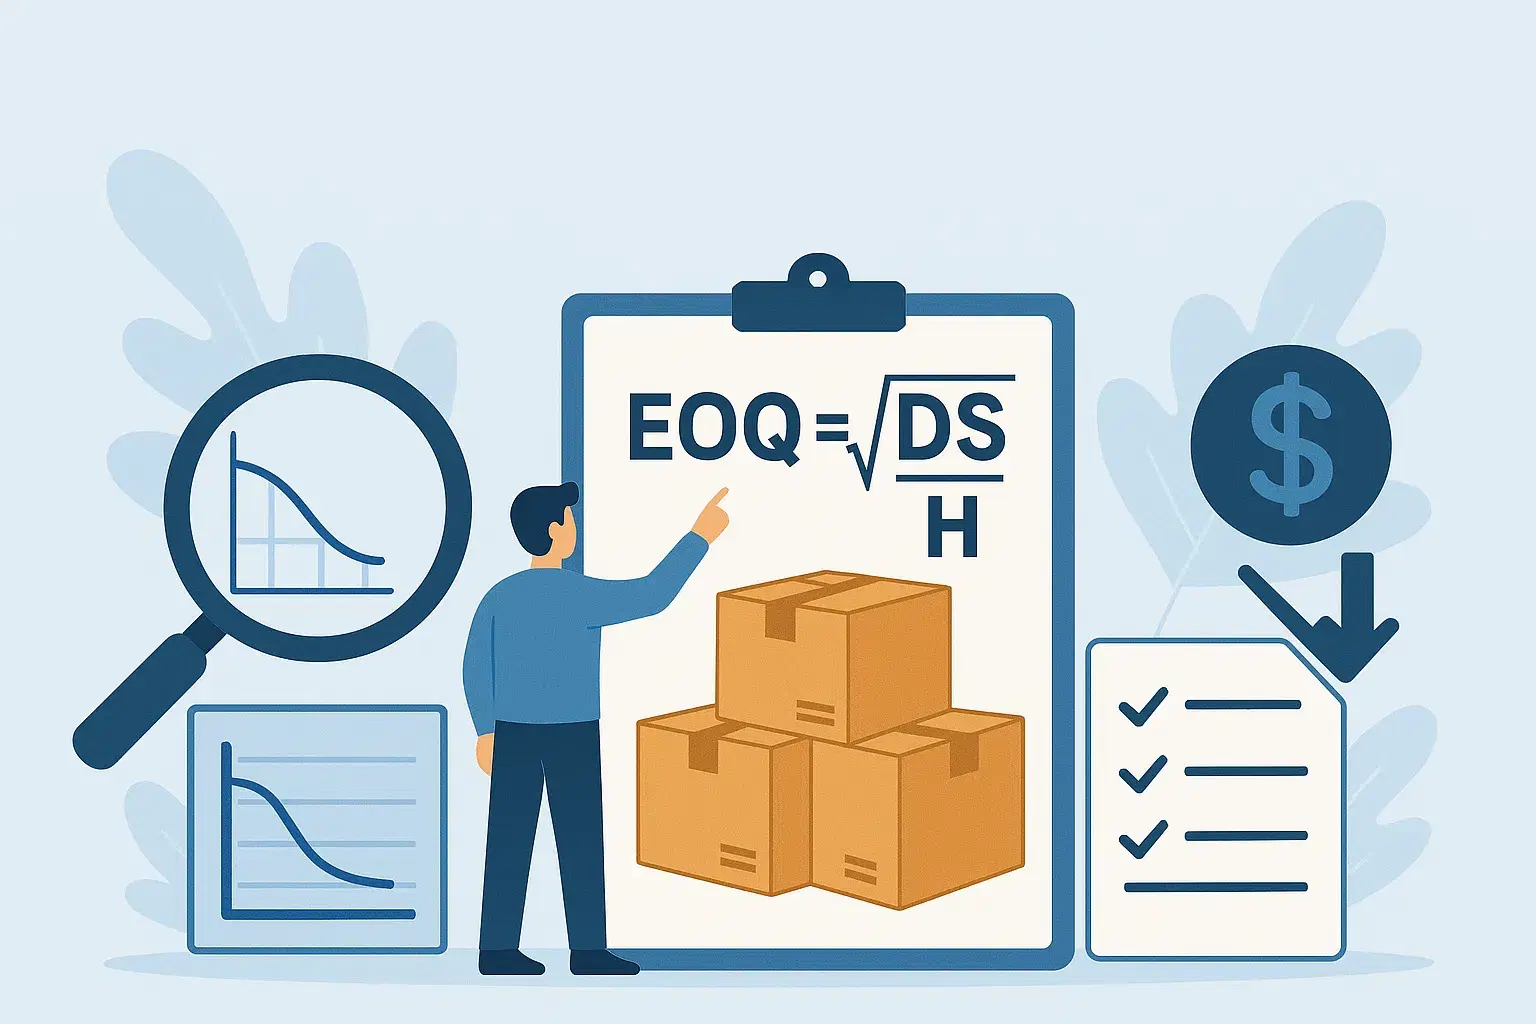
EOQ = √(2DS / H)
Where:
- D = Annual demand (units)
- S = Cost per order (ordering or setup cost)
- H = Holding cost per unit per year
Applying EOQ helps businesses avoid overstocking and understocking, reduce warehousing and carrying costs, and improve cash flow and purchasing decisions.
Why EOQ Matters in Inventory Management
EOQ matters because it turns ordering from guesswork into a calculation, and poor ordering is where a lot of inventory cost hides. When the balance between too much and too little stock is off, it hits everything from cash flow to customer satisfaction.
Common Cost Challenges Businesses Face
Most businesses struggle with three things. Overstocking, where buying in bulk without a clear forecast leaves excess inventory sitting idle, tying up capital and raising storage costs. Frequent small orders, which drive up ordering costs through shipping fees, admin effort, and supplier surcharges. And high holding costs, which include not just storage but depreciation, insurance, and the risk of unsold goods going obsolete. Over time these inefficiencies eat into margins and make it harder to scale.
How EOQ Solves the Equation
By calculating the ideal order size from demand, ordering cost, and holding cost, EOQ helps businesses avoid over-purchasing, reduce ordering frequency, and lower storage costs. It prevents money from being locked up in unsold stock, means fewer orders overall, and keeps inventory volumes lean.
The knock-on effect reaches procurement and cash flow. Less capital tied up in inventory frees cash for other needs. Predictable ordering patterns lead to stronger supplier terms. And with the right amount of stock always on hand, businesses reduce back orders, fulfil faster, and keep customers happy.
Steps to Implement EOQ in Inventory Management
Implementing EOQ is not complicated, but getting real results means approaching it with the right data. Here is the process step by step.
1. Gather Key Data
Before any calculation, you need three inputs. Annual demand (D), the number of units you sell or use in a year. Ordering cost (S), the cost of placing one order, including shipping, processing, and supplier handling. And holding cost (H), the cost of storing one unit for a year, covering warehousing, insurance, depreciation, and potential spoilage. The more accurate your inputs, the more valuable your result. Real-time inventory data, or integration with your inventory software, keeps this precise instead of a guess.
2. Calculate EOQ Using the Formula
Once you have the data, plug it into the formula:
EOQ = √(2DS / H)
A simple example, with D = 10,000 units per year, S = $50 per order, and H = $2 per unit per year:
EOQ = √(2 × 10,000 × 50 / 2) = √(1,000,000 / 2) = √500,000 = approx. 707 units
So the ideal order quantity is about 707 units per order to minimise total inventory costs.
3. Adjust Reorder Points and Order Intervals
EOQ tells you how much to order, but you still need to know when to order. That is where reorder points come in.
Based on your average lead time and daily demand, you can calculate when to place the next order to ensure stock arrives just in time. The reorder point formula walks through exactly how to do that, with a worked example. With EOQ in place, your ordering becomes more structured, fewer surprises, fewer last-minute rushes, and more confident planning.
4. Monitor and Optimise Regularly
One of the biggest mistakes is treating EOQ as a set-and-forget formula. Markets shift, demand evolves, and supplier prices change. Review your EOQ inputs regularly, especially during seasonal spikes, supply disruptions, or changes in storage costs. Revisiting it every quarter or during major inventory reviews keeps it serving your business rather than holding it back.
Real-World Example of EOQ Reducing Inventory Costs
Take a mid-sized fashion retailer with multiple stores and a central warehouse. Before EOQ, the team ordered on gut feel and past experience. They often bought in bulk to chase discounts, which led to overstocking slow movers and understocking bestsellers.
The problems stacked up. Overstocking drove high warehousing costs and markdown losses. Popular items went out of stock, costing sales. And irregular orders made vendor coordination difficult.
After implementing EOQ, the team calculated it for key SKUs using real-time demand data, average order cost, and holding costs. Ordering was streamlined, with each SKU on an optimised quantity and frequency. Stock levels settled into line with actual sales. Reorder points were automated, cutting manual effort.
Within three months, the results were clear: warehousing costs down around 20 percent through better turnover, roughly 30 percent fewer stockouts on top sellers, and improved vendor planning with fewer urgent orders, which led to better supplier terms.
Limitations and Considerations
EOQ is valuable, but it is not one-size-fits-all. It works best with stable demand, predictable lead times, and consistent holding and ordering costs. It can fall short in a few situations:
- Highly fluctuating demand. When demand swings with seasonality or market shifts, EOQ based on average data goes stale fast.
- Perishable goods. For short shelf-life items like food or pharmaceuticals, holding stock longer to save cost can cause spoilage.
- Bulk discounts or dynamic pricing. EOQ assumes fixed order costs, but a supplier discount on larger orders can make deviating from EOQ worthwhile.
- Irregular supplier lead times. EOQ assumes consistent lead times. If suppliers vary, you still need safety stock as a buffer.
The Role of Technology in Making EOQ Smarter
To be practical in a fast-moving retail environment, EOQ should be paired with a modern inventory management system. These systems pull real-time data, automate the calculation, and adjust reorder points dynamically based on sales patterns, lead times, and trends. Folded into a broader demand forecasting strategy, EOQ shifts from a static formula to a live part of inventory optimisation, balancing cost-efficiency with responsiveness.
How Digital Tools Automate EOQ Calculations
The EOQ formula is simple in theory, but applying it consistently across a large product range is not. That is where automation earns its place.
Manual EOQ does not scale. In a real retail setup you are dealing with hundreds or thousands of SKUs, each with its own demand rate, supplier cost, and holding expense. Updating EOQ by hand as those inputs shift is slow and error-prone, and if you are doing it in spreadsheets, you are probably either overstocking to play safe or constantly reacting to stockouts.
Cloud-based inventory management takes the grunt work out. These tools continuously analyse inventory movement, update demand patterns in real time, and suggest or apply EOQ adjustments automatically. That means orders at the right time in the right quantity, holding and ordering costs balanced dynamically, reorder points that move with demand, and procurement decisions that are faster and more data-driven.
How Supplymint Automates and Optimises EOQ
Supplymint's inventory planning software takes EOQ further by combining real-time inventory tracking with AI-assisted demand forecasting. Instead of static demand estimates or fixed cost assumptions, the platform learns from your data over time, so you can predict seasonal shifts and adjust EOQ automatically, set intelligent reorder points based on stock velocity and lead times, monitor inventory health across locations, and align purchasing with your wider inventory goals. Whether you run a chain of stores or handle B2B distribution, it makes EOQ scalable and responsive instead of a calculation that goes stale.
Conclusion
Mastering inventory is not just about knowing what to stock. It is about knowing how much and when to order, and that is exactly what economic order quantity gives you. Used as a strategic tool, EOQ helps businesses make smarter purchasing decisions, cut unnecessary cost, and keep stock aligned with real demand. Whether the problem is overstocking, rising storage costs, or inconsistent order cycles, EOQ is a proven way to take back control, and paired with automation and real-time data, it gets sharper still.
Frequently Asked Questions
1. What is economic order quantity (EOQ)?
Economic order quantity is the ideal order size that minimises the total cost of ordering and holding inventory. It helps businesses decide how much stock to order at a time to meet demand while keeping costs as low as possible.
2. What is the EOQ formula?
The EOQ formula is EOQ = √(2DS / H), where D is annual demand in units, S is the cost per order, and H is the holding cost per unit per year. It balances ordering costs against holding costs to find the lowest-cost order size.
3. How do you calculate economic order quantity?
Gather three inputs: annual demand, cost per order, and annual holding cost per unit. Then apply EOQ = √(2DS / H). For example, with demand of 10,000 units, an order cost of $50, and a holding cost of $2 per unit, EOQ works out to about 707 units per order.
4. What are the advantages of economic order quantity?
EOQ reduces total inventory costs, prevents overstocking and stockouts, lowers storage and ordering costs, improves cash flow by freeing capital, and supports better supplier planning through predictable ordering.
5. What are the limitations of EOQ?
EOQ assumes stable demand, predictable lead times, and fixed costs. It is less reliable for highly variable demand, perishable goods, situations with bulk discounts, or irregular supplier lead times, where safety stock and dynamic tools are still needed.
6. What is the difference between EOQ and reorder point?
EOQ tells you how much to order. The reorder point tells you when to order, based on lead time and daily demand. They work together: EOQ sets the order size, and the reorder point triggers the order in time for stock to arrive before you run out.