
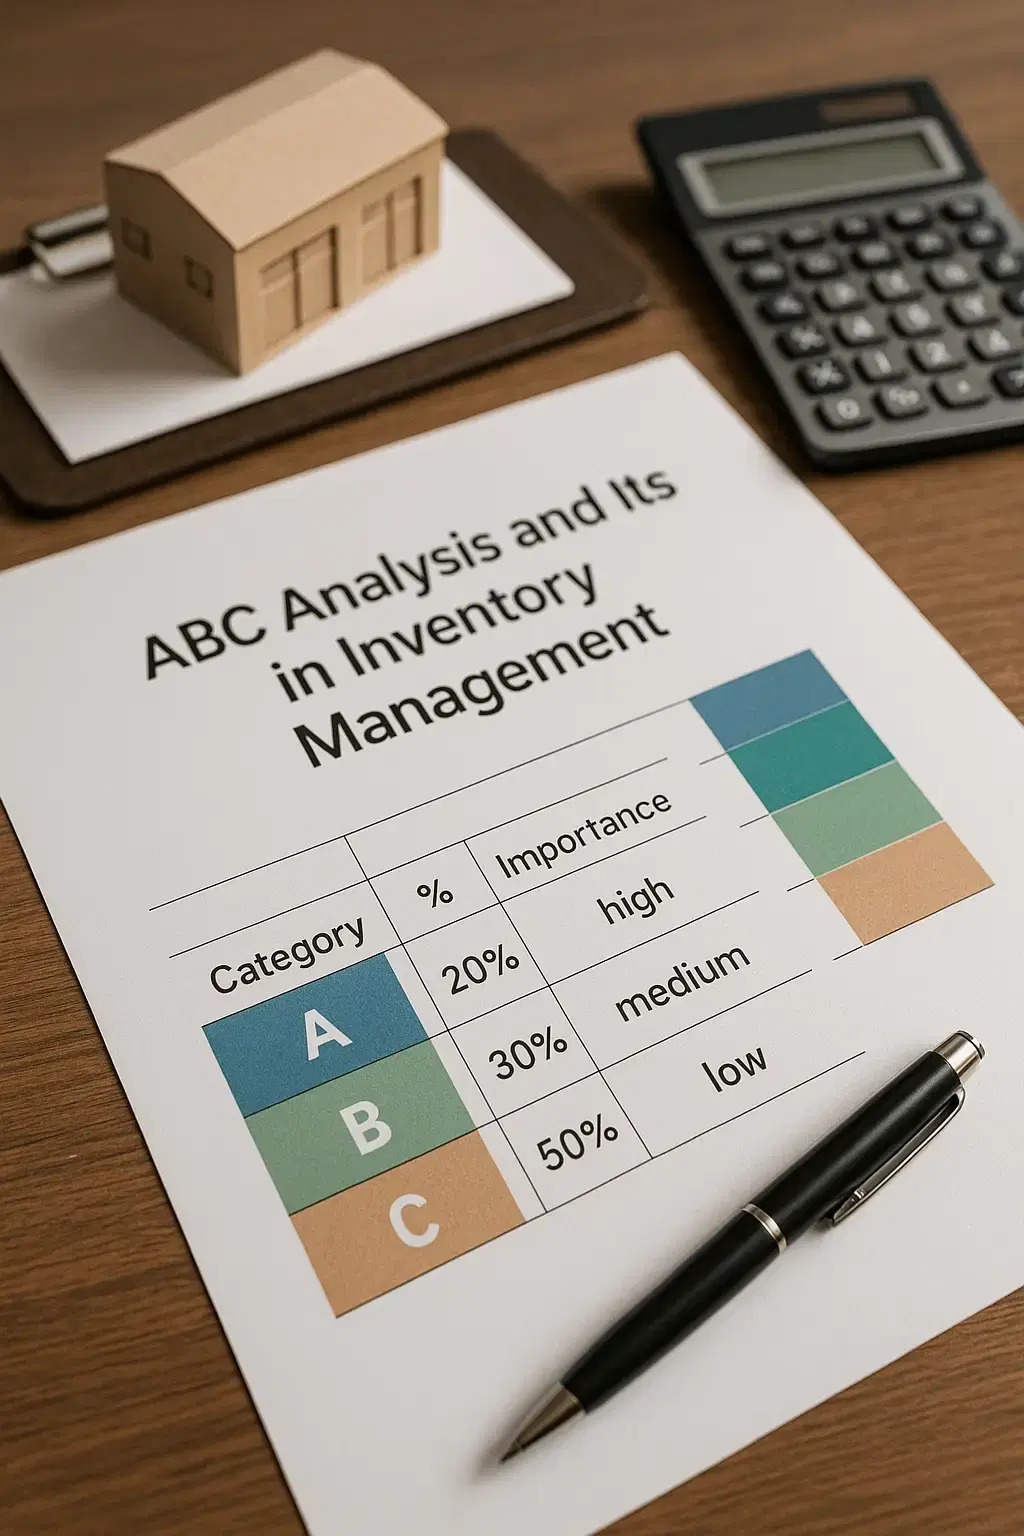
ABC analysis is an inventory management technique that sorts stock into three groups, A, B and C, based on how much value each item contributes to the business. Category A holds the small number of items that account for most of the inventory value, category C holds the large number of items that add up to very little value, and category B sits in between. Instead of managing every SKU with the same level of attention, businesses put their tightest controls on category A and looser, low-effort controls on category C.
Now that the definition is out of the way, here's why this matters in practice.
Imagine managing a warehouse with 10,000 different SKUs, from fast-moving bestsellers to items that gather dust for months. Treating each product with equal importance not only wastes time but also eats into profits. That's where smart inventory classification comes in, and ABC analysis is one of the most effective techniques in the game.
Used by retailers, manufacturers, and supply chain professionals worldwide, ABC analysis helps businesses prioritize inventory based on its value and impact on operations. It gives clarity on which products drive revenue and which ones quietly pile up costs.
So, what is ABC analysis, and how does it improve inventory efficiency? In this blog, we'll break down the full form, explain how it works, and explore how it can transform the way you manage inventory, whether you're overseeing a fashion brand, a grocery chain, or a distribution center.
ABC Analysis Full Form and Meaning
At first glance, "ABC" might sound like a simple acronym, but in inventory management, it's a powerful framework that helps businesses separate the essentials from the extras.
The full form of ABC in ABC analysis stands for:
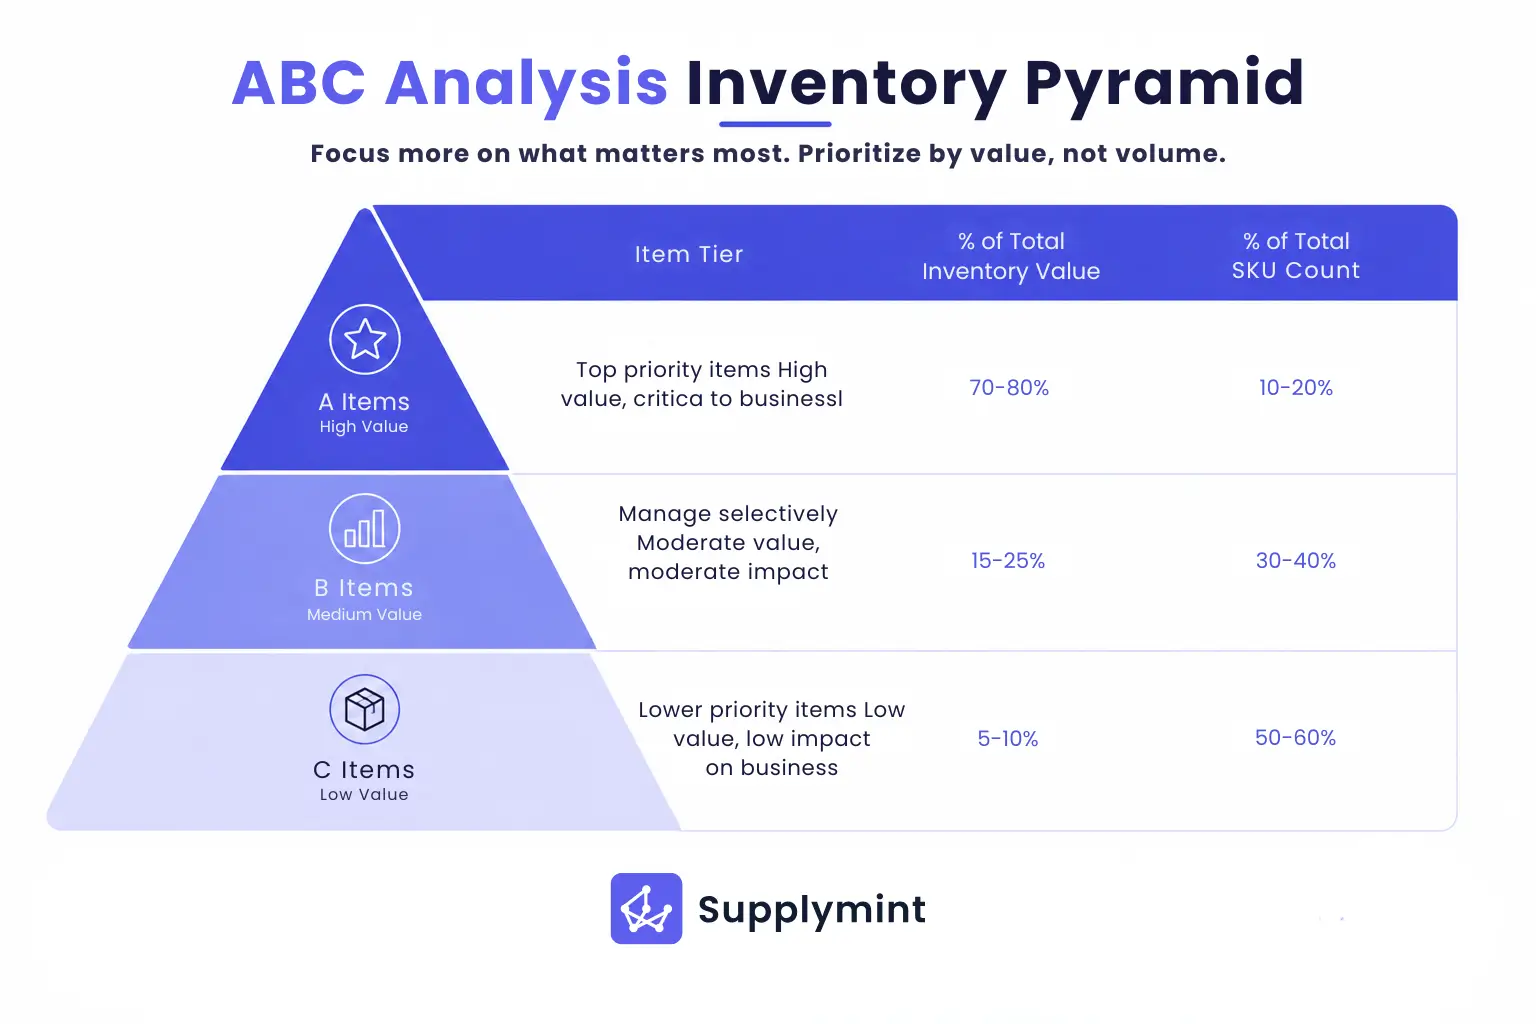
A – "Always Important": These are your top performers. They make up a small portion of your total inventory but account for the highest value, typically 70-80% of your total consumption value. These items demand the most attention, tighter controls, and accurate forecasting.
B – "Balanced" or "Moderate Importance": These are your middle-tier items. Not too hot, not too cold. They contribute moderately to your inventory value and typically require standard monitoring.
C – "Cheapest or Common": These are the low-value, high-volume items, like packaging material, accessories, or small spare parts. While they're necessary, they don't significantly impact your bottom line and can be managed with looser controls.
This classification system uses consumption value (cost × usage rate) to segment inventory. Instead of treating every item equally, ABC analysis allows you to focus resources on what matters most, resulting in smarter stocking decisions, optimized procurement, and reduced carrying costs.
But its applications don't stop at the warehouse. ABC analysis also finds a home in cost accounting, helping finance teams allocate budgets more efficiently by recognizing which inventory items drive cost and revenue.
How ABC Analysis Works in Inventory Management
At the heart of ABC analysis in inventory management lies the Pareto Principle, also known as the 80/20 rule. It suggests that 80% of outcomes come from 20% of causes. Applied to inventory, this means that a small percentage of items typically account for the majority of your inventory value.
Here's how the classification typically works:
Category A: These are the top 10-20% of items that account for around 70-80% of the total inventory value. These products need strict monitoring, accurate demand forecasting, and tight inventory control, as they significantly impact your revenue and profitability.
Category B: These are the next 30% of items, contributing to about 15-25% of the inventory value. They require moderate control and regular reviews, often acting as a buffer between high-value and low-value items.
Category C: These make up the remaining 50-60% of your inventory but represent just 5-10% of the value. While low in cost, they're often high in quantity and should be managed with bulk ordering or looser controls to save time and effort.
By applying this segmentation, businesses can focus their time, budget, and resources on items that truly drive value, instead of spreading efforts thin across their entire inventory.
Ultimately, ABC analysis in inventory management helps you make smarter purchasing and stocking decisions, reducing holding costs, improving order frequency, and ensuring that your high-priority items are never out of stock.
While ABC analysis is primarily known as an inventory management technique, it also plays a valuable role in cost accounting. Both applications use the same classification framework but apply it differently to solve unique operational and financial challenges.
Let's break it down:
|
Aspect |
ABC Inventory Control |
ABC Analysis in Cost Accounting |
|---|---|---|
|
Purpose |
Prioritize stock based on consumption value |
Prioritize cost allocation and control for budgeting and decision-making |
|
Focus Area |
Inventory movement, order frequency, and stocking strategy |
Cost of goods sold, indirect costs, budgeting and financial planning |
|
Users |
Supply chain teams, warehouse managers, retail operations |
Finance teams, cost accountants, procurement budgeting teams |
|
Benefits |
Prevent stockouts of high-value items, reduce overstock, and optimize storage |
Understand which products/services drive costs, improve profitability analysis |
|
Example Use Case |
Ensuring 'A' class items are restocked quickly while 'C' class items are ordered in bulk |
Analyzing production costs by categorizing materials into A, B, and C importance |
Real-World Impact
In ABC inventory control, a warehouse manager might use the classification to ensure top-selling products (A items) are always in stock, while minimizing effort spent on lesser-moving goods.
In ABC analysis in cost accounting, a finance team might analyze which inputs or processes contribute the most to cost, and look for ways to optimize procurement or reduce waste.
Benefits of ABC Analysis
1. Better Resource Allocation
ABC analysis helps teams prioritize high-impact items (Category A), allowing them to allocate time, budget, and effort where it matters most, increasing efficiency across procurement, warehousing, and planning.
2. Reduced Carrying Costs
By managing low-priority inventory (Category C) with looser controls or bulk orders, businesses can reduce excess stock, free up storage space, and lower holding costs.
3. Improved Forecasting and Ordering
With clearer insight into which items move faster and contribute most to sales, procurement teams can fine-tune order quantities and frequencies, resulting in fewer stockouts and overstock situations.
4. Focused Vendor Management
ABC analysis enables businesses to build stronger relationships with vendors supplying high-value items, negotiate better terms, and streamline reorder processes, leading to improved supply chain performance.
To understand how ABC analysis works in action, let's look at a basic example with 10 inventory items, categorized based on their annual consumption value (i.e., unit cost × quantity used annually). This helps prioritize stocking and purchasing efforts more effectively.
Sample Inventory List
|
Item |
Annual Usage (Units) |
Cost per Unit ($) |
Annual Consumption Value ($) |
Category |
|---|---|---|---|---|
|
Item A |
1,000 |
100 |
100,000 |
A |
|
Item B |
2,000 |
50 |
100,000 |
A |
|
Item C |
5,000 |
10 |
50,000 |
B |
|
Item D |
3,000 |
15 |
45,000 |
B |
|
Item E |
4,000 |
8 |
32,000 |
B |
|
Item F |
10,000 |
2 |
20,000 |
C |
|
Item G |
8,000 |
1.5 |
12,000 |
C |
|
Item H |
15,000 |
0.8 |
12,000 |
C |
|
Item I |
6,000 |
1 |
6,000 |
C |
|
Item J |
7,000 |
0.5 |
3,500 |
C |
How to Calculate ABC Analysis: Step by Step
Once you understand the theory, the actual calculation is straightforward. Here's how to run an ABC analysis on your own inventory data.
Step 1: List every item and gather its usage data Pull the annual usage quantity and the cost per unit for each SKU. Most inventory or ERP systems can export this directly.
Step 2: Calculate the consumption value for each item This is the core formula behind ABC analysis:
Consumption Value = Annual Usage Quantity × Cost per Unit
An item that sells 1,000 units a year at $100 each has a consumption value of $100,000, even if a cheaper item sells in much higher volume.
Step 3: Sort items from highest to lowest consumption value Rank the full list so the highest-value items appear first.
Step 4: Calculate the running (cumulative) percentage of value Add up the consumption value as you move down the sorted list, and express each running total as a percentage of the grand total:
Cumulative % of Value = (Running Total Value ÷ Total Inventory Value) × 100
Do the same for the number of items, so you can see cumulative % of items alongside cumulative % of value.
Step 5: Set your classification cutoffs Most businesses use these as a starting point, then adjust based on their own data:
- Category A: items that make up roughly the first 70 to 80% of cumulative value, usually the top 10 to 20% of items by count
- Category B: the next 15 to 25% of cumulative value, usually the next 30% of items
- Category C: the remaining 5 to 10% of value, usually the last 50% of items
Step 6: Assign each item to its category and review periodically Tag every SKU as A, B or C in your system. Usage patterns shift with seasons and demand, so most teams re-run this analysis quarterly or at least twice a year rather than treating it as a one-time exercise.
Quick check using the table above: Items A and B together cross roughly 40% of total value while being only 2 of the 10 items, which is why they land in category A. Items F through J make up half the item count but barely a quarter of the value, landing them in category C.
Classification Logic
A Category (Top 20%): Items A & B – Together, they represent ~40% of the total inventory value.
B Category (Next 30%): Items C, D, and E – They form ~35% of the inventory value.
C Category (Bottom 50%): Items F to J – These contribute ~25% of the value but take up most of the stockroom space.
How It Improves Reorder Planning
Category A items are closely monitored and reordered more frequently to prevent stockouts.
Category B items are reviewed regularly but don't need constant attention.
Category C items are ordered in bulk at longer intervals to minimize administrative effort and reduce costs.
This simple classification allows teams to focus their efforts where it counts, ensuring high-value products are always available and lower-value items don't clog up warehouse space or budgets.
ABC analysis is most effective when businesses are managing large, diverse inventories, especially where not all items contribute equally to revenue or operational efficiency. Here's when it makes the most sense to implement this strategy:
Ideal Industries & Scenarios
Retail & E-commerce: Where thousands of SKUs vary in value and sales frequency, ABC analysis helps prioritize fast-moving, high-margin products.
Manufacturing: Useful for managing raw materials and components, especially when production depends on a few high-value inputs.
Pharmaceuticals & Healthcare: Enables prioritization of life-saving or high-demand drugs over lower-cost, slow-moving items.
Auto Parts & Spare Parts Management: Helps focus on parts with high turnover or critical demand.
For Large, Diverse Inventories
Businesses with hundreds or thousands of SKUs often struggle to manage everything equally. ABC analysis brings structure to that chaos, allowing procurement and operations teams to allocate time and resources more strategically. When paired with a cloud-based inventory management system, it becomes even more powerful, offering real-time insights and automation to streamline decision-making and boost efficiency.
Seasonal vs. Consistent Demand Products
For seasonal items, ABC analysis helps forecast and stock just the right amount ahead of peak periods.
For consistent demand products, it helps determine optimal reorder levels and minimize excess stock.
In short, if your business handles a wide range of inventory with varying sales velocity or cost impact, ABC analysis provides the clarity and control needed to optimize performance and cut unnecessary costs.
How Digital Tools Simplify ABC Analysis
While ABC analysis is conceptually simple, manually categorizing inventory across hundreds or thousands of SKUs can be time-consuming, error-prone, and difficult to maintain consistently. That's where digital tools and cloud-based inventory systems step in to make the process faster, smarter, and more accurate.
Automation for Real-Time ABC Classification
Modern inventory software can automatically track:
- Item cost
- Usage frequency
- Inventory value over time
With this data, the system can instantly classify items into A, B, or C categories, and adjust them as trends shift, without manual calculations. This not only saves time but also ensures your categorization reflects real-time business activity.
How Supplymint Helps
With tools like Supplymint's Inventory Planning Software, businesses can:
- Automatically segment inventory using ABC analysis
- Set category-specific reorder rules and replenishment triggers
- Monitor inventory health with visual dashboards and smart alerts
- Align procurement and stocking with actual product performance
Whether you're managing seasonal items in fashion retail or critical components in manufacturing, Supplymint helps you turn data into action, optimizing your inventory mix with precision and ease.
Final Words
In a world where inventory complexity is increasing, ABC analysis remains a timeless and effective tool to bring clarity, control, and cost-efficiency to your supply chain. By classifying products based on their consumption value, businesses can prioritize what matters most, optimizing resources, reducing waste, and boosting profitability.
If you've ever wondered what ABC analysis is and how it can improve your inventory planning, the answer is simple: it empowers smarter decisions through smarter classification.
Brands running ABC analysis across hundreds of SKUs and stores often automate it with a retail supply chain management software like Supplymint, so priority items never run short.
Frequently Asked Questions
1. What does ABC stand for in ABC analysis?
ABC does not stand for a specific phrase. It simply names the three categories the technique sorts inventory into: A for high-value items, B for moderate-value items, and C for low-value items.
2. Is ABC analysis the same as the Pareto principle?
ABC analysis is built on the Pareto principle, but it isn't identical to it. The Pareto principle is the general 80/20 idea that a small share of causes drives most of the outcomes. ABC analysis applies that idea specifically to inventory by sorting items into three tiers instead of just two.
3. What's the difference between ABC analysis and ABC classification?
They refer to the same thing. "ABC classification" and "ABC analysis" are used interchangeably in inventory management, both describing the process of grouping stock into A, B and C tiers by value.
4. What are the main advantages and disadvantages of ABC analysis?
The biggest advantage is that it lets teams focus limited time and budget on the items that actually move the needle on cost and revenue. The main drawback is that it looks at value alone, so it can undervalue items that are cheap but critical, like a low-cost part that stops a production line if it runs out. For a full breakdown, see our dedicated guide on ABC analysis advantages and disadvantages.
5. How often should a business update its ABC analysis?
Most businesses re-run the analysis quarterly, or at minimum twice a year. Categories can shift when a new product launches, a seasonal item spikes in demand, or a previously slow mover suddenly picks up.
6. Can ABC analysis be used outside of inventory management?
Yes. The same value-based sorting logic applies to customer segmentation, vendor management, and even cost accounting, anywhere a business needs to tell its highest-impact items or accounts apart from the rest.